Chapter 3 - Flight Performance and Planning
| Navigation: <- Previous Chapter 2 | Table of Contents | Chapter 3 | Next -> Chapter 4 |
These notes are exam-focused for CASA PPL performance/planning. Use aircraft-specific POH/AFM charts and CASA regulatory assumptions exactly as stated in each scenario.
How to use this chapter
| Label | Meaning |
|---|---|
| CASA Primary | Part 91 MOS fuel policy, CASA workbook assumptions, legal reserve rules in scenarios |
| PHAK Secondary | Performance theory (density altitude, W&B concepts); POH charts are always aircraft-specific |
Study habits: Trace a takeoff distance problem on the POH chart with pencil twice — zero-wind baseline, then wind correction. Sketch a W&B moment diagram when CG moves with fuel burn.
3.1 Performance Fundamentals
- Aircraft performance depends on four main groups:
- Aerodynamics (lift/drag)
- Propulsion (engine/propeller efficiency)
- Environment (pressure altitude, temperature, wind, runway condition)
- Mass/configuration (weight, CG, flap/gear state)
- Never use rule-of-thumb when a chart/table is provided.
3.2 Density Altitude and Why It Matters
Why this matters
High density altitude simultaneously hurts engine power, prop thrust, and wing lift — exam scenarios often stack hot day, high field, and heavy weight.
Ask yourself: If takeoff distance increases, does your climb gradient over trees still clear obstacles on the POH chart?
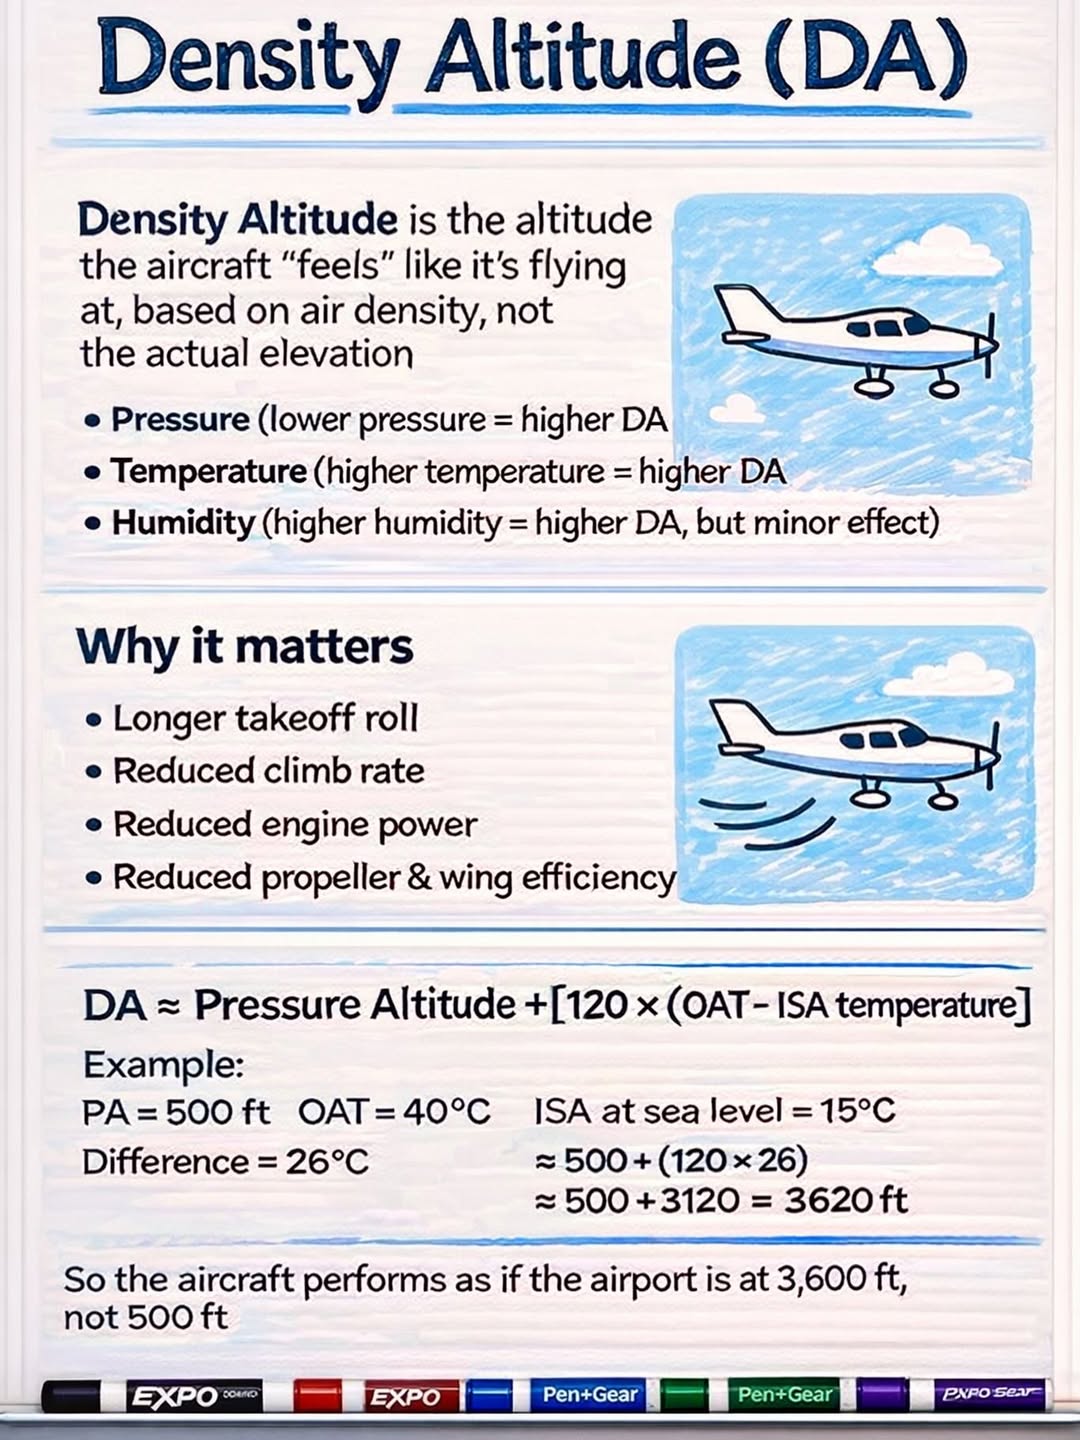
- High density altitude reduces:
- Engine power
- Propeller thrust
- Wing lift at a given IAS (longer takeoff/landing distance due to TAS/ground speed effects)
- Typical causes: high temperature, high elevation, low pressure.
- Operational result:
- Longer takeoff roll
- Poorer climb rate and climb gradient
- Reduced obstacle clearance margin.
3.3 Takeoff Performance
- Inputs to chart calculations commonly include:
- Pressure altitude
- OAT
- Aircraft weight
- Wind component
- Runway slope/surface
- Flap setting and obstacle requirement
- Distinguish:
- Ground roll
- Distance to 50 ft obstacle
- Apply corrections in required sequence per POH.
Worked example: takeoff distance chart (C172-style POH logic)
Illustration only — use your aircraft POH/AFM charts and correction order. Numbers below are for exam method practice.
Given (departure):
| Input | Value |
|---|---|
| Field elevation | 2,000 ft |
| QNH | 29.80 inHg (low pressure) |
| OAT | 32°C |
| Weight | 2,400 lb |
| Flaps | 10° (short-field chart if used) |
| Runway | Sealed level dry |
| Wind | 8 kt headwind |
| Requirement | Distance to clear 50 ft obstacle |
Step 1 — Pressure altitude (PA)
PA ≈ elevation + (1013 - QNH_hPa) × 30 (if QNH in hPa)
With QNH 29.80 inHg (~1009 hPa): PA ≈ 2000 + (1013 - 1009) × 30 ≈ 2,120 ft (round per chart axis).
Step 2 — Density altitude (DA) sense-check
DA ≈ PA + 120 × (OAT - ISA temp at PA)
ISA temp at 2,000 ft ≈ 15 - 2×2 = 11°C. OAT 32°C → ISA + 21 → DA ≈ 2120 + 120×21 ≈ 4,640 ft (performance will feel “much higher” than field elevation).
Step 3 — Read base chart at weight
- Enter takeoff chart at PA ≈ 2,100 ft, OAT 32°C, weight 2,400 lb.
- Example chart read (illustrative): ground roll ~1,050 ft; distance over 50 ft ~1,850 ft.
Step 4 — Apply corrections in POH order (typical sequence — verify POH)
| Correction | Example rule (illustrative) | On 1,850 ft |
|---|---|---|
| Headwind 8 kt | Often ~−10% per 10 kt headwind (POH table) | −~15% → ~1,570 ft |
| Dry sealed level | Baseline | — |
| If grass/wet | +20% to +50% etc. per POH | Add if applicable |
Step 5 — Compare to runway + obstacle
- Available runway length must exceed obstacle distance, not ground roll alone.
- Add operational margin (technique, wind gust, DA uncertainty).
Exam traps in this workflow: using field elevation instead of PA; skipping temperature line; applying tailwind as headwind; interpolating between grid lines incorrectly (see §3.11).
High-yield planning checks
- Accelerate-stop and reject decision awareness (conceptual for PPL).
- Crosswind component compared against demonstrated or operational limits.
- Abort criteria before takeoff briefing.
Real-life example 1: hot-day departure from inland aerodrome
- Scenario:
- C172-type aircraft, two adults, near training-day fuel load.
- Aerodrome elevation around 1,800 ft.
- OAT 34 C by midday, light quartering tailwind on preferred runway.
- Trees and rising terrain beyond departure end.
- Performance effect:
- High temperature + elevation increases density altitude significantly.
- Takeoff roll and distance to 50 ft obstacle both increase.
- Initial climb gradient reduces, even if IAS targets are flown correctly.
- Practical decision:
- Recompute using POH chart with actual OAT/wind/surface corrections.
- If obstacle margin becomes thin, reduce weight (less fuel or baggage), wait for cooler time, or use a more favorable runway if available.
- Brief a clear abort point (for example, “not airborne by X marker -> reject”).
Real-life example 2: short grass strip after overnight rain
- Scenario:
- Light GA aircraft departing from a private strip.
- Runway is short, grass surface, and still damp/soft after rain.
- Light headwind appears favorable, but runway rolling resistance is high.
- Performance effect:
- Ground roll can increase markedly on soft/wet grass even with headwind.
- Acceleration is slower, so rotate point happens later than on sealed runway.
- Obstacle clearance performance may become the limiting factor, not just lift-off.
- Practical decision:
- Apply POH grass/soft-field corrections (if provided), or conservative margin if not explicitly charted.
- Use soft-field technique exactly per POH and avoid performance assumptions from dry sealed runway operations.
- If margins are weak, offload weight or delay departure until surface improves.
Real-life example 3: crosswind-limited takeoff choice
- Scenario:
- Adequate runway length, cool morning conditions.
- Forecast and observed winds produce crosswind near pilot’s personal limit.
- Alternate runway has less crosswind but shorter available distance.
- Performance effect:
- Longer runway does not help if controllability in crosswind is the main risk.
- Shorter runway can still be acceptable if takeoff distance and obstacle margins remain valid.
- Practical decision:
- Compare both options with the same disciplined process:
- Crosswind component vs pilot/aircraft limit.
- Takeoff and obstacle performance for actual runway.
- Go/no-go trigger if tracking/control is unstable during roll.
- Choose the runway that keeps both controllability and distance margins acceptable.
- Compare both options with the same disciplined process:
3.4 Climb and En Route Performance
- Best angle (VX) vs best rate (VY) purpose and trade-offs.
- Climb performance degrades with:
- Altitude and temperature
- Higher weight
- Incorrect speed/mixture settings.
- Cruise planning:
- TAS from performance chart
- Fuel flow at selected power setting
- Endurance and range computation.
3.5 Landing Performance
- Inputs similar to takeoff charts:
- Weight
- Pressure altitude
- Temperature
- Wind
- Surface/slope
- Flap/configuration
- Distinguish:
- Landing ground roll
- Distance over threshold obstacle.
- Add practical margins for runway condition, approach stability, and pilot technique variation.
Worked example: landing distance chart (C172-style POH logic)
Illustration only — confirm correction order and factors in your POH.
Given (arrival):
| Input | Value |
|---|---|
| Field elevation | 1,500 ft |
| QNH | 1018 hPa |
| OAT | 28°C |
| Landing weight | 2,200 lb |
| Flaps | Full |
| Runway | Sealed dry |
| Wind | 5 kt tailwind (exam favourite) |
| Requirement | Landing distance over 50 ft obstacle |
Step 1 — Pressure altitude
- QNH 1018 hPa → slightly below standard → PA ≈ 1,440 ft (≈ elevation).
Step 2 — Chart read (illustrative)
- At PA ~1,500 ft, 28°C, 2,200 lb, full flap: ground roll ~550 ft; over 50 ft ~1,250 ft.
Step 3 — Wind correction
| Wind | Typical effect (illustrative) | On 1,250 ft |
|---|---|---|
| 5 kt tailwind | Often +10% per 2 kt or per POH table — large increase | +25% to +50% possible → 1,560–1,875 ft |
| 5 kt headwind | Decrease | Opposite sign — exam trap |
Step 4 — Decision
- Chart assumed zero wind; real tailwind materially erodes margin.
- Wet runway, late flare, or unstabilised approach adds distance beyond chart.
flowchart LR
    A[Chart base distance] --> B[PA and OAT entry]
    B --> C[Weight and flap]
    C --> D[Wind correction]
    D --> E[Surface/slope]
    E --> F[Compare to runway + margin]
Real-life example 1: destination runway with wet surface
- Scenario:
- Planned arrival at regional aerodrome with sealed runway.
- Light rain has made the surface wet, with reported braking “fair.”
- Aircraft landing weight is near upper normal training range.
- Performance effect:
- Wet surface generally increases landing roll and reduces braking effectiveness.
- Even with legal distance, stopping margin can shrink quickly if touchdown is long.
- Practical decision:
- Recalculate landing distance using POH correction and wet-runway margin policy.
- Prioritize stabilized approach and touchdown in the aiming zone.
- If expected margin is narrow, plan alternate with longer/drier runway before descent.
Real-life example 2: tailwind temptation to avoid circuit delay
- Scenario:
- Busy CTAF environment and pilot considers landing opposite preferred direction to save time.
- Resulting tailwind component is small but non-zero.
- Performance effect:
- Tailwind increases groundspeed at touchdown.
- Landing roll increases disproportionately; float also tends to increase.
- A “small” tailwind can erase safety margin on shorter strips.
- Practical decision:
- Treat tailwind as a major performance penalty, not a convenience trade.
- Use headwind runway unless operationally unsafe/impractical.
- If tailwind landing is unavoidable, verify distance over obstacle and rollout margins with conservative buffer.
Real-life example 3: unstable approach at otherwise suitable runway
- Scenario:
- Runway length appears sufficient on paper.
- On final, aircraft is high and slightly fast due to late descent setup.
- Pilot is tempted to salvage landing because runway is “long enough.”
- Performance effect:
- Excess speed adds significant float distance and touchdown point moves down runway.
- Actual landing distance can exceed chart assumption because POH numbers assume correct threshold crossing speed and technique.
- Practical decision:
- Enforce stabilized approach gates.
- If not stabilized by gate, go around early and set up again.
- In real operations, approach quality is as important as chart math in landing distance outcomes.
3.6 Weight and Balance (W&B)
Sketch it: Datum line, arms for front seats, baggage, and fuel — arrow showing CG shift as aft fuel burns.
- Core formulas:
Moment = Weight × Arm
CG = Total moment / Total weight
- Verify:
- MTOW and landing weight limits
- Baggage/compartment limits
- CG within envelope at each stage (takeoff/landing)
- Fuel burn shifts CG; check both departure and arrival conditions.
CASA workbook exam convention
- AVGAS specific gravity commonly assumed as 0.72 kg/L in exam workbook contexts.
Common loading scenarios (exam patterns)
| Scenario | Loading pattern | Typical CG tendency | Risk |
|---|---|---|---|
| Solo from front | Pilot only, forward seats | More forward CG | Higher stall speed trend; nosewheel load |
| Dual training | Instructor + student front | Mid-forward | Usually benign if within envelope |
| Two rear passengers | Mass at aft arms | Aft CG shift | Reduced stability; easier pitch-up near stall |
| Heavy baggage aft | Baggage compartment full | Aft CG | Check aft limit at takeoff and landing |
| Full fuel | Fuel tanks per POH arms | Depends on tank location (172: often forward of aft seats) | May move CG forward at start |
| Low fuel landing | Fuel burned off | CG often moves aft if fuel was forward of CG | Aft limit check at landing critical |
CG envelope shifts with fuel burn
Rule: removing weight at an arm aft of the aircraft CG moves the CG forward; removing weight forward of CG moves CG aft.
| Fuel tank location (conceptual) | As fuel burns | CG movement |
|---|---|---|
| Wing tanks (near mid-CG on 172) | Small shift | Monitor but often modest |
| Forward fuselage tank | Weight lost forward | CG drifts aft |
| Aft fuselage tank (rare on trainers) | Weight lost aft | CG drifts forward |
Worked scenario A: aft limit risk (two rear passengers + baggage)
| Item | Weight (kg) | Arm (m) | Moment |
|---|---|---|---|
| BEW | 680 | 2.30 | 1564 |
| Front seats (2) | 170 | 2.40 | 408 |
| Rear seats (2) | 140 | 3.20 | 448 |
| Baggage | 25 | 3.60 | 90 |
| Fuel (full) | 90 | 2.20 | 198 |
| Takeoff | 1105 | 2708 |
- Takeoff CG = 2708 / 1105 = 2.45 m → plot on envelope; may be near aft limit.
- Burn 45 kg fuel (arm 2.20): weight 1060, moment 2708 - 99 = 2609 → CG = 2.46 m (often further aft if fuel was forward of CG).
Worked scenario B: forward limit risk (solo + full fuel + forward baggage)
- Solo heavy pilot + full fuel + only forward loading → CG near forward limit.
- Rotation/runway performance may suffer; elevator authority at flare may be high.
Worked scenario C: within envelope both ends
- Two occupants front, half fuel, no baggage → mid-envelope at takeoff; landing after burn → re-check still inside envelope.
Graphical example: W&B loading and fuel-burn shift
flowchart LR
    A[Start: Empty aircraft CG in envelope] --> B[Add pilot and passengers]
    B --> C[Add baggage and fuel]
    C --> D{Takeoff CG in envelope?}
    D -- No --> E[Re-distribute load or offload weight]
    D -- Yes --> F[Compute landing weight and CG after planned fuel burn]
    F --> G{Landing CG in envelope?}
    G -- No --> H[Revise fuel/load plan]
    G -- Yes --> I[Dispatch]
Worked W&B mini example (conceptual)
| Item | Weight (kg) | Arm (m) | Moment (kg-m) |
|---|---|---|---|
| Empty aircraft | 680 | 2.30 | 1564.0 |
| Pilot + front passenger | 150 | 2.40 | 360.0 |
| Rear passenger | 70 | 3.20 | 224.0 |
| Baggage | 20 | 3.60 | 72.0 |
| Fuel at start | 90 | 2.20 | 198.0 |
| Takeoff total | 1010 | - | 2418.0 |
- Takeoff CG = 2418 / 1010 = 2.39 m (must be checked against POH envelope).
- If 50 kg fuel is burned from a tank near arm 2.20 m:
- Landing weight = 960 kg
- Landing moment = 2418 - 110 = 2308 kg-m
- Landing CG = 2308 / 960 = 2.40 m
- Key point: CG moves with fuel burn; always verify both takeoff and landing conditions.
3.7 Fuel Planning and Reserves
CASA Primary: Part 91 MOS / workbook fuel policy (fixed vs variable reserve, alternate fuel). PHAK Secondary: general fuel planning structure.
Real-world application
Plan fuel to a target, not a legal minimum — diversion, holding, and headwinds consume margin faster than the spreadsheet suggests.
Regulatory basis: CASR Part 91 and Part 91 MOS (Table 2) plus CASA AC 91-15 — Guidelines for aircraft fuel requirements. Exam questions may use workbook labels or Part 91 terms — read the scenario.
CASA fuel policy — terms you must distinguish
| Term (exam / workbook) | Part 91 MOS term | Meaning |
|---|---|---|
| Fixed reserve | Final reserve fuel | Prescribed time at holding/range speed after trip (and alternate/holding if applicable) — must remain on landing |
| Variable reserve | Contingency fuel | Extra fuel for unforeseen factors — often % of trip fuel where required |
| Alternate fuel | Destination alternate fuel | Fuel from destination (or decision point) to alternate incl. approach/missed approach as required |
Typical piston aeroplane ≤ 5,700 kg MTOW (PPL training aircraft — C172, DA40 class):
| Flight type | Final reserve (fixed) | Contingency (variable) |
|---|---|---|
| Day VFR | 30 minutes | Not required (N/A in MOS Table 2 item) |
| Night VFR | 45 minutes | Not required (N/A for this category item) |
| Larger / IFR categories | 45 minutes (typical) | 5% of trip fuel (where applicable) |
Always use the flight rules and aircraft category stated in the question.
Fuel planning building blocks
Fuel required =
  Taxi / run-up
  + Trip fuel (planned route)
  + Holding fuel (if required)
  + Destination alternate fuel (if required)
  + Contingency fuel (variable reserve — if applicable)
  + Final reserve fuel (fixed reserve)
- Trip fuel: planned route consumption at planned power/RPM and fuel flow.
- Alternate fuel: only when an alternate is required (weather, aerodrome, rules in scenario).
- Final reserve is protected — not for planning “extra sightseeing.”
- Operational uplift above legal minimum is good airmanship but is not the same as legal compliance.
When is alternate fuel required? (exam logic)
- Apply scenario rules: destination weather below minima, no instrument approach at destination when needed, isolated aerodrome policy, etc.
- Alternate fuel generally includes: go-around/missed approach at destination + climb + cruise to alternate + approach at alternate (use data given in exam).
How to construct a fuel plan (step-by-step)
- Calculate trip fuel (distance/GS or time × fuel flow).
- Add taxi/run-up.
- Determine if alternate is required → add alternate fuel.
- Add contingency (variable reserve) if applicable to aircraft/flight type.
- Add final reserve (fixed reserve) for flight type (30 min day / 45 min night for typical PPL piston).
- Compare total to usable fuel; convert L → kg if W&B needs mass (× 0.72 workbook SG).
- Brief in-flight checks and diversion triggers.
Worked example: Day VFR (CASA workbook-style piston)
| Component | Calculation | Litres |
|---|---|---|
| Taxi/run-up | Given | 6 |
| Trip | 2.0 hr × 32 L/hr | 64 |
| Contingency (variable) | Day VFR small piston — N/A | 0 |
| Final reserve (fixed) | 30 min × 32 L/hr | 16 |
| Alternate | Not required in scenario | 0 |
| Minimum fuel required | 86 |
- Usable onboard 100 L → margin 14 L (legal but thin for headwind — add operational buffer).
Worked example: Night VFR with alternate
| Component | Calculation | Litres |
|---|---|---|
| Taxi | 6 | |
| Trip | 1.5 hr × 32 L/hr | 48 |
| Alternate fuel | Given in question (e.g. cruise to alternate + approach) | 18 |
| Contingency | N/A for typical item | 0 |
| Final reserve (fixed) | 45 min × 32 L/hr | 24 |
| Total | 96 |
Worked example: IFR / larger aircraft style (variable reserve applies)
| Component | Calculation | Litres |
|---|---|---|
| Trip | 100 L | 100 |
| Contingency (variable) | 5% × trip | 5 |
| Final reserve (fixed) | 45 min at flow | 24 |
| Subtotal policy fuel | 129 (+ taxi/alternate as required) |
CASA Exam Cues — fuel policy
- Fixed reserve = final reserve (time-based, must remain on landing).
- Variable reserve = contingency (% trip where applicable) — not the same as final reserve.
- Day VFR training piston: often 30 min final reserve, no 5% contingency.
- Night VFR: often 45 min final reserve — exam trap using 30 min.
- Do not double-count: alternate fuel is separate from trip to destination.
- Exam may give zero wind for nav but fuel must still cover actual headwind if you replan in flight (contingency/higher trip).
Fuel planning quick table
| Component | Formula/Method | Day VFR example |
|---|---|---|
| Taxi/start | Fixed allowance | 6 L |
| Trip | Time × fuel flow | 64 L |
| Alternate | Per scenario | 0 L |
| Variable reserve (contingency) | % trip if applicable | 0 L |
| Fixed reserve (final) | Reserve time × fuel flow | 16 L (30 min) |
| Total required | Sum | 86 L |
3.8 Navigation Log and Time/Fuel Management
- A navigation log (nav log) is the pilot’s planning-and-monitoring worksheet that links:
- Route geometry (track, distance)
- Wind and speed assumptions (heading, groundspeed)
- Time control (ETE/ETA)
- Fuel control (leg fuel, cumulative burn, reserve status)
- At PPL exam level, nav log questions usually test:
- Unit discipline (minutes vs hours, kt vs NM)
- Time calculations from groundspeed
- Fuel trend updates when actual GS differs from planned
- Decision timing (continue, divert, or turn back)
Key definitions (exam-useful)
- Leg: one segment between two waypoints.
- Track (TRK): planned path over the ground for a leg.
- Heading (HDG): direction flown after wind correction to maintain planned track.
- Groundspeed (GS): actual speed over the ground (kt).
- ETE (Estimated Time En Route): planned time for a leg.
- ETA (Estimated Time of Arrival): expected arrival time at a waypoint/destination.
- ATO/ATA (Actual Time Over/Actual Time of Arrival): observed real crossing/arrival time used for updates.
- Fuel flow: planned fuel consumption rate (e.g., L/hr).
- Leg fuel: fuel expected/used on one leg.
- Cumulative fuel used: total burned from departure to current point.
- Fuel remaining: usable fuel onboard after cumulative burn.
- Endurance: time remaining at current/assumed fuel flow.
Standard nav log construction workflow
- Enter leg distance and planned track for each waypoint pair.
- Apply forecast wind to obtain heading and planned GS.
- Compute leg ETE from distance and GS.
- Build ETAs from departure time plus cumulative ETE.
- Compute planned leg fuel and cumulative planned fuel.
- Carry forward planned fuel remaining and reserve check at each waypoint.
Worked example 1: preflight nav log timing and fuel
- Scenario assumptions:
- Departure time: 0930 UTC
- Cruise fuel flow: 30 L/hr
- Leg 1 distance: 48 NM, planned GS: 96 kt
- Leg 2 distance: 72 NM, planned GS: 90 kt
- Calculations:
- Leg 1 ETE = 48 / 96 = 0.50 hr = 30 min
- Leg 2 ETE = 72 / 90 = 0.80 hr = 48 min
- Destination ETA = 0930 + 30 + 48 = 1048 UTC
- Leg 1 fuel = 0.50 x 30 = 15 L
- Leg 2 fuel = 0.80 x 30 = 24 L
- Trip fuel total = 39 L
- Exam point: keep minutes and decimal hours consistent; many errors come from mixing them.
Worked example 2: in-flight groundspeed update
- Actual at first waypoint:
- Planned ATO: 1000 UTC
- Actual ATO: 1008 UTC (8 minutes late)
- Interpretation:
- Actual GS on Leg 1 was lower than planned.
- Remaining legs should be recalculated, not left as original plan.
- Quick update method (ratio approach):
- Planned Leg 1 time = 30 min, actual = 38 min
- Time ratio = 38/30 = 1.27 (about 27 percent slower than planned)
- Apply caution: full ratio is a rough estimate only; best practice is recalc with current wind/GS estimate.
- If remaining planned time was 48 min:
- Rough revised remaining = 48 x 1.27 = 61 min
- Revised ETA about 1008 + 61 = 1109 UTC
- Fuel effect at 30 L/hr:
- Extra 13 min = 0.22 hr
- Extra fuel about 0.22 x 30 = 6.6 L
- Decision point:
- Compare revised fuel-on-arrival against required reserve.
- If reserve trend is eroding, divert early while options remain.
Worked example 3: reserve protection decision trigger
- Scenario:
- Usable fuel at departure: 110 L
- Taxi/start: 5 L
- Planned trip: 2.4 hr at 30 L/hr -> 72 L
- Required reserve for scenario: 45 min -> 22.5 L
- Planned fuel on arrival:
- 110 - 5 - 72 = 33 L (reserve protected with 10.5 L margin)
- In-flight deterioration:
- New expected trip time: 2.9 hr -> 87 L trip fuel
- New expected arrival fuel: 110 - 5 - 87 = 18 L
- Outcome:
- Expected arrival fuel is now below required reserve (22.5 L).
- Correct PPL-theory answer: do not continue as planned; divert or adjust immediately.
Common nav log exam traps
- Using TAS where GS is required for time calculation.
- Forgetting to convert minutes to decimal hours for fuel math.
- Updating ETA but forgetting to update fuel and reserve status.
- Continuing to destination after reserve erosion is already evident.
- Rounding too early and compounding error across multiple legs.
3.9 ETP/PNR and Diversion Concepts (PPL level)
- PNR: point where continuing and returning have equivalent limiting resource outcome (often fuel/time logic).
- ETP: equal-time point between two alternates or destinations.
- These are planning/risk tools that help trigger timely diversion decisions.
Graphical example: PNR logic on a two-way route
flowchart LR
    A[Departure A] --> B[Track toward B]
    B --> C{At PNR?}
    C -- Before PNR --> D[Returning to A usually uses less limiting resource]
    C -- After PNR --> E[Continuing to B usually uses less limiting resource]
Graphical example: ETP between two aerodromes
flowchart LR
    A[Aerodrome A] --> M[ETP]
    M --> B[Aerodrome B]
    M --> C[Decision point: choose best option by weather, runway, fuel trend]
Practical mini example (time-based ETP)
- Distance A to B: 180 NM.
- Groundspeed toward B: 90 kt.
- Groundspeed back to A (with headwind): 75 kt.
- Let distance from A to ETP be
x(NM). - Time to continue from ETP to B:
(180 - x) / 90. - Time to return from ETP to A:
x / 75. - At ETP, times are equal:
(180 - x) / 90 = x / 75
x≈ 82 NM from A.- Use: before 82 NM, return may be faster; after 82 NM, continue may be faster (subject to weather/runway/fuel constraints).
3.10 Key Definitions and Practical Examples
- Density altitude: pressure altitude corrected for non-standard temperature; indicates “how the aircraft feels” aerodynamically.
- Example: hot day at inland aerodrome can create DA much higher than field elevation, degrading climb.
- Takeoff distance over 50 ft: total distance from brake release to crossing 50 ft.
- Example: runway that appears long enough for ground roll may still be insufficient for obstacle-clearance requirement.
- CG envelope: approved center-of-gravity range for safe controllability/stability.
- Example: aft-loaded aircraft may rotate easily but become unstable and harder to recover near stall.
- Fixed reserve (final reserve fuel): prescribed time-based fuel that must remain on landing (e.g. 30 min day VFR / 45 min night VFR for typical PPL piston).
- Example: cannot “plan to land on fumes” if that would consume final reserve.
- Variable reserve (contingency fuel): extra fuel for unforeseen factors — often percentage of trip where applicable.
- Example: 5% trip fuel on categories where MOS Table 2 requires contingency.
- Alternate fuel: fuel to proceed to nominated alternate when required by rules/scenario.
- Example: destination below minima → plan destination + alternate + reserves.
- Crosswind component: wind component perpendicular to runway heading.
- Example: runway headwind may still include high crosswind that exceeds pilot or aircraft limits.
Scenario: high DA departure decision
- Planned departure at midday, high temperature, near-max weight, rising terrain ahead.
- Safer action: reduce weight and/or depart in cooler period, then recompute takeoff and climb gradient using POH charts.
3.11 Pre-Exam Revision (Must Know · Nice to Know · Common Traps)
Sketch it: Wind triangle or nav log one leg; POH takeoff chart with wind correction annotated; W&B moment arm with fuel burn arrow.
Must know
- Takeoff and landing distance from POH charts (including wind correction).
- Density altitude effect on performance (engine, prop, wing).
- W&B: moments, CG envelope, CG at landing after fuel burn.
- Nav log: time, fuel, GS, ETA; ETP/PNR concepts at PPL level.
- CASA Primary fuel: fixed (final) vs variable (contingency) reserve; alternate fuel when required.
- Zero-wind chart baseline vs actual wind correction.
Nice to know
- Climb gradient and obstacle clearance concepts.
- ETP/PNR formula structure when workbook provides it.
- Interpolation discipline (two-step temperature/pressure).
Common traps
| Area | Trap | Fix |
|---|---|---|
| Charts | Zero-wind baseline with actual wind given | Apply POH headwind/tailwind correction |
| Charts | Ground roll vs 50 ft obstacle distance | Answer the distance type asked |
| Charts | Field elevation vs pressure altitude on chart | Read POH axis labels |
| Fuel | 30 min reserve on night VFR when 45 min applies | Match MOS/scenario |
| Fuel | Fixed vs variable reserve confused | Label each leg on plan |
| W&B | CG checked only at departure | Recompute at landing weight |
| Units | kg/L, kt/NM mixed | Write units on every line |
- Using IAS when GS required for timing; rounding too early on interpolation.
- Legal minimum fuel vs operational target; workbook 0.72 kg/L without question basis.
3.12 Formula Pack and Graphics
Core formulas
Time (hr) = Distance (NM) / GS (kt)
Fuel used = Fuel flow × Time
Groundspeed = Distance / Time
Moment = Weight × Arm
CG = Sum(moments) / Sum(weights)
Useful conversion and planning formulas
Fuel mass (kg) ≈ Fuel volume (L) × SG
For CASA workbook style AVGAS assumptions:
Fuel mass (kg) ≈ Fuel volume (L) × 0.72
PA ≈ elevation + (1013 - QNH_hPa) × 30
DA ≈ PA + 120 × (OAT - ISA temp)
Graphic: performance planning flow
flowchart LR
    A[Weather and runway data] --> B[Takeoff and climb check]
    B --> C[En route TAS, GS, fuel flow]
    C --> D[Landing performance check]
    D --> E{Margins acceptable?}
    E -- Yes --> F[Dispatch]
    E -- No --> G[Reduce weight, delay, or reroute]
Performance sensitivity table
| Parameter change | Takeoff roll | Climb rate | Landing distance |
|---|---|---|---|
| Higher temperature | Increases | Decreases | Usually increases |
| Higher pressure altitude | Increases | Decreases | Usually increases |
| Higher weight | Increases | Decreases | Increases |
| Tailwind | Increases significantly | N/A climb after takeoff | Increases significantly |
| Wet/soft runway | Increases | N/A | Increases |
References
CASA Primary
- CASA RPL/PPL/CPL Aeroplane Workbook: https://www.casa.gov.au/rpl-ppl-and-cpl-aeroplane-workbook
- CASA AC 91-15 — Guidelines for aircraft fuel requirements: https://www.casa.gov.au/guidelines-aircraft-fuel-requirements
- Part 91 MOS (fuel Table 2): https://www.legislation.gov.au/
- Aircraft POH/AFM performance and W&B sections
PHAK Secondary / supplementary
- FAA PHAK (performance and W&B chapters): https://www.faa.gov/regulations_policies/handbooks_manuals/aviation/phak
- ICAO Doc 8168 (PANS-OPS, procedural context): https://www.icao.int/
- EASA Easy Access Rules (Air Operations): https://www.easa.europa.eu/en/document-library/easy-access-rules
| Navigation: <- Previous Chapter 2 | Table of Contents | Chapter 3 | Next -> Chapter 4 |
IMPORTANT: Always verify with current official publications.
prepared by Raptor K, a guy learning to fly (feel free to contact me via IG: @raptorkwok or Email)